Images Collection
View this article in Search Friendly Plain Text
NOTE: This plain text article interpretation has been digitally created by OCR software to estimate the article text, to help both users and search engines find relevant article content. To read the actual article text, view or download the PDF above.
THE INFLUENCE OF OUABAIN ON INTRACELLULAR SODIUM AND POTASSIUM CONCENTRATIONS IN THE RABBIT MYOCARDIUM
RICHARD S. TUTTLE, PETER N. WITT and ALFRED FARAH Department of Pharmacology, State University of New York, Upstate Medical Center, Syracuse, New York
Reprinted from Vol. 133, No. 3
The Journal op Pharmacology and Experimental Therapeutics
September, 1961
Copyright © 1961 by The Williams «fe Wilkins Co. Printed in U.S.A.
Uepvintod from Ina Journal op Pharmacology and Experimental Therapeutic* Pi 183> No‘3 n September, 1001
Copyright ® 1061 by The Williams & Wilkins Co.
Printed in U.S.A,
8696
THE INFLUENCE OF OUABAIN ON INTRACELLULAR SODIUM AND POTASSIUM CONCENTRATIONS IN THE RABBIT MYOCARDIUM1
RICHARD S. TUTTLE,2 PETER N. WITT and ALFRED FARAH Department of Pharmacology, State University of New York, Upstate Medical Center, Syracuse, New York
Received for publication February 28, 1961
One current concept of the action of the cardioactive glycosides is based on experiments which show that they reduce the intracellular potassium (K+) concentration in myocardium (Hajdu and Leonard, 1959), red blood cells (Schatzmann,
1953) and skeletal muscle (Schatzmann and Witt,
1954) . In certain concentrations these drugs reduce myocardial K+ by blocking potassium influx without affecting its efflux (Schreiber, 1956; Rayner and Weatherall, 1957; Vick and Kahn, 1957). A relationship between heart rate and the onset of cardioactive drug action has been reported (Wilbrandt et al., 1953; Sanyal and Saunders, 1958). This suggests that increased muscle activity may facilitate the mechanism by which the glycosides improve the contractility of heart muscle. There is evidence that the concentration and fluxes of the K+ ion may be related to the level of myocardial activity. Schreiber (1956) and Rayner and Weatherall (1957) observed that K+ efflux may be increased by increased myocardial activity and Wilde and O’Brien3 (1953) reported that an increased out-flux of potassium was associated with each action potential. Vick and Kahn (1957) observed that in guinea-pig hearts stimulated at rates above the intrinsic rhythm a K+ loss occurred. The evidence that both the cardioactive glycosides and increased heart rate produce a net loss of K+ from myocardium and an increase in contractile force has led Hajdu and Leonard (1959) to postulate that “potassium loss is causally related to the increase in contractility.” Several investigators (Hagen, 1939; Wedd, 1939; Boyer and Poindexter, 1940; Kühns, 1959) have not found
1 This investigation was supported in part by PHS Traineeship No. 2G-293 from the National Institutes of Health, Division of Research Grants, U. S. Public Health Service, and the American Heart Association.
2 Upjohn Fellow.
3 Wilde, W. S. and O’Brien, J. M.: Abstr. 19th Int. Physiol. Congr., p. 889, 1953.
a decrease in intracellular K+ concentration in myocardial muscle exposed to so-called “therapeutic” concentrations of the cardioactive glycosides. Vick and Kahn (1957) produced a 50% increase in contractility of the failing guinea-pig heart with 1.3 X 10“7 M ouabain. The net loss of K+ accompanying this was small and of questionable significance. Rayner and Weatherall (1957) reported that only concentrations of ouabain which produced contracture and failure in rabbit atria reduced K+ influx. Therefore, it appears that changes in myocardial K+may be related to certain glycoside concentrations which do not produce the clinically important positive inotropic effect.
Our experiments were designed to determine the effects of different concentrations of ouabain on rabbit myocardial K+ and sodium (Na+) concentrations and to relate these to changes in contractility. Rabbit hearts were exposed to ouabain by injection into the intact rabbit or by addition of the drug to muscle baths containing isolated left atria. Changes in the electrocardiogram (ECG) and contractility during injection into intact animals and changes in contractile tension in the isolated atria were used as indices of “toxic” or “therapeutic” effects of ouabain.
Method. Isolated left atria from rabbits were used in this investigation because their rate could be controlled by means of electrical stimulation. Rabbits weighing 2 to 3 kg were sacrificed by a blow on the head and the hearts rapidly removed. The left atria were separated from the hearts, mounted on silver-silver chloride electrodes and placed in constant temperature baths (37.5 =b 0.5°C) containing 5 ml of oxygenated Tyrode’s solution (95% O2 and 5% CO2) of the following composition: NaCl 137 mM, KC1 2.67 mM, CaClj 1.8 mM, MgCh 0.6 mM, NaHCOs 12.0 mM, NaH¡2pO^ 0.4 mM, and glucose 5.5 mM (pH 7.4). The free ends of the atria were attached by silver wire to strain gauges and isometric tension re-
corded on an ink-writing polygraph. Supramaximal stimuli of 5 milliseconds’ duration were delivered to the muscles at a rate of 4 beats per second. At the beginning of each experiment the tension of all atria was adjusted so that the muscle responded to a stimulus with a maximal contraction.
Groups of 10 to 15 atria stimulated at 4/second were incubated in Tyrode’s solution for 30, 60 or 120 minutes. Isometric tension was recorded throughout and intracellular K+ and Na+concentrations determined at the end of the incubation periods. Other atria were treated as above but 5 X 10⁻⁸ or 1 X 10“6 M ouabain4 was added to the muscle baths. For comparison, unstimulated atria were placed in Tyrode’s solution for 30, 60 or 120 minutes and intracellular K+ and Na+ concentrations measured at the end of the incubation periods. The effects of 10-7, 10“6 and 10“5 M ouabain on the K+ and Na+ concentrations were similarly determined in other groups of unstimulated atria.
The influence of repeated injections of different amounts of ouabain on the heart in the intact rabbit was investigated. Rabbits weighing 2 to 3 kg were anesthetized with pentobarbital (42 mg/kg i.v.), the external jugular vein was can-nulated and the ECG was recorded as Lead II. After 15 minutes of control recordings, 11 rabbits received 0.050 mg of ouabain/kg/30 minutes until irregularities appeared in the ECG (total dose 0.20 to 0.25 mg/kg). A second group of 11 rabbits received 0.025 mg of ouabain/kg/30 minutes for a period of 105 minutes (total dose 0.100 mg/kg). Ten control animals received a total of 4 to 5 saline injections every 30 minutes over a period of 90 to 120 minutes. The total volume of fluid injected did not exceed 9 ml/kg. At the end of the infusion period the rabbits in each group were sacrificed and the left and right atria and portions of the left and right ventricles were dissected out. The tissues were washed rapidly in Tyrode’s solution, blotted lightly on moist filter paper, and weighed to the nearest 0.1 mg. Intracellular K+ and Na+ ion concentrations were determined. The myocardial water content was determined in other groups of similarly treated rabbits by placing the heart tissues in tared vessels and drying them overnight at 110°C to a constant weight. Relative changes in the force of contraction of the heart brought about by pentobarbital and ouabain were determined in open-chest rabbits by passing a silver wire through the apex of the heart and connecting it to a tension transducer. This method, although crude, gave unequivocal results.
Determination of interstitial space. In order to obtain values for intracellular K+ and Na+, the volume of the interstitial space must be known. Inulin was used to determine this volume in both contracting (1.0 beat per second) and quiescent left atria. The rate of equilibration with, and the volume of the interstitial space were determined by measuring the inulin content in atria incubated in 1% (w/v) inulin in Tyrode’s solution for periods of 2.5 to 120 minutes. At the end of each incubation period 8 atria were removed from the inulin solution and blotted lightly on moist filter paper. The atria were weighed to the nearest 0.1 mg and placed for 24 hours in 3 ml of cold 10% (w/v) trichloracetic acid. They were then homogenized, centrifuged and a 2-ml aliquot removed for inulin analysis. The inulin concentration in the bathing solution was also determined. Controls prepared from atria incubated for various times in inulin-free Tyrode’s solution were also analyzed by the inulin method and used as blank values. Inulin was determined by the alcoholic resorcinol method of Schreiner (1950) and the recovery in 100 atria ranged between 95 and 102% with an average of 97%. The volume of the interstitial space was calculated from the inulin concentration in the Tyrode’s solution and in the atria. This was reported* as ml of inulin solution per 100 g of atrial tissue. In order to determine if total tissue water changed through exposure to inulin, groups of atria were incubated for 30, 60 and 120 minutes in 1% inulin Tyrode’s solution and their water content was determined by measuring wet and dry weight.
Determination of intracellular K+ and Na+ concentrations. Ventricular and atrial tissues were blotted, weighed and placed in plastic tubes containing 4 ml of 14 N nitric acid. After 24 hours the digest was heated slowly to the boiling point and then diluted to 20 ml with ion-free water. An aliquot was removed and placed in a model 21 Coleman flame photometer for K+ and Na+measurements. Blank values were obtained by determining K+ and Na+ concentrations in a digest mixture of nitric acid and ion-free water. The addition of a known amount of K+ or Na+ to the digest mixture and their recovery following the digest procedure assured that a minimum of K+ or Na+ was lost from the atria as a result of the procedure. After correction for 22% interstitial space, the ion concentrations in the myocardium were reported as mEq/kg of fiber weight.
Fiber weight is defined in this investigation as simply the wet weight of the atrium corrected for 22% interstitial space. Therefore, the fiber weight of a 200-mg atrium is 156 mg. Values for intracellular K+ and Na+ ion concentrations are there-
fore lower than those obtained from calculations based on the concentrations per mEq of fiber water.
The mean values for intracellular K+ and Na+ concentrations in different experimental groups were subjected to t tests (Fisher, 1954) to establish the significance of a possible change.
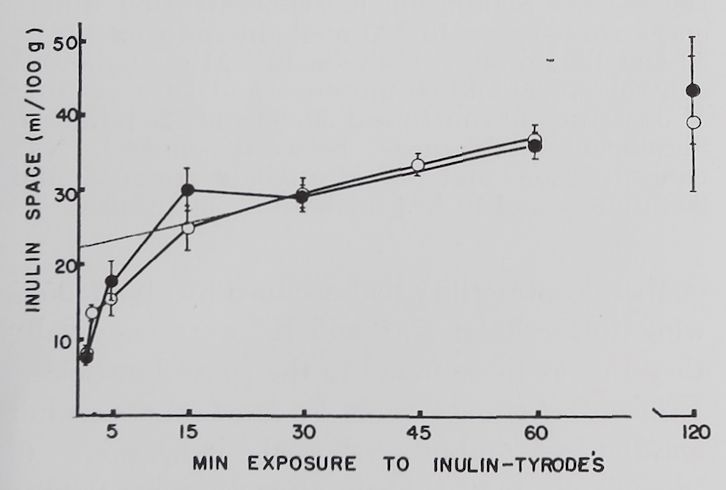
Results. The rate of uptake of inulin by resting and contracting rabbit atria is shown in figure 1. The exchange of inulin solution with interstitial space fluid occurred at two rates, an initial fast one which was completed in about 20 to 30 minutes, followed by a slow exchange lasting for the duration of the experiment. An increase in sugar space With prolonged incubation in sucrose and other sugar solutions has been reported by other investigators (Danielli and Davson, 1941; Cotlove, 1954; Conway, 1957).
The slow component of our inulin curve may represent adsorption of inulin by cell surfaces or movement into the intracellular compartment. The fact that total muscle water did not increase measurably (after 30 minutes incubation 85%, after 60 minutes 84%, and after 120 minutes 83 fi water content, 11 measurements) suggests that edema was not a contributing factor to the increase in inulin space. This does not rule out the possibility of cell shrinkage which could lead to an increase in the interstitial space volume without a change in total muscle water. There was no significant difference between inulin values in resting atria and those stimulated at 1/second.

Fig. 1. Volume of the space accessible to inulin in left atria of rabbits.
Abscissa: length of incubation in 1.0% (w/v) inulin Tyrode’s solution. Ordinate: ml of the 1.0% inulin solution per 100 g of atrial tissue. Open circles: quiescent atria; solid circles: atria stimulated at 1.0/second: dotted line: extrapolation of slow component to zero time. Each point is the average of 8 atria. Standard errors of the means are indicated by vertical lines.


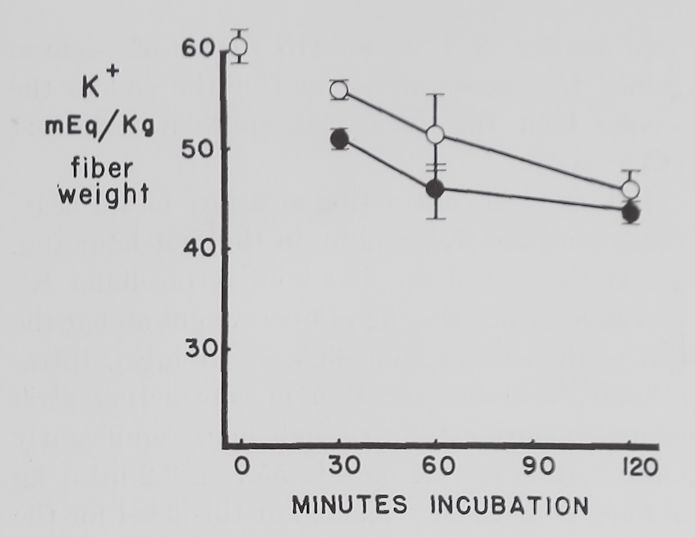
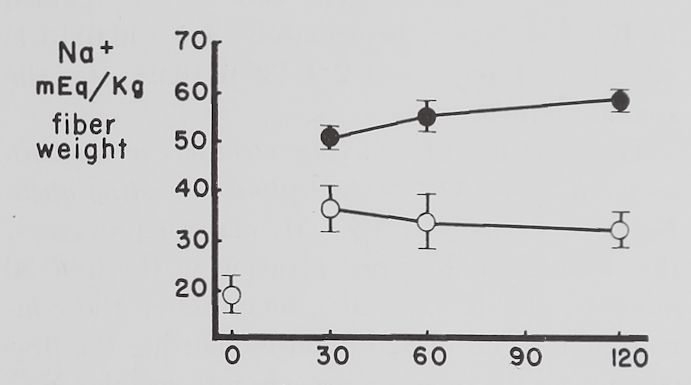
Fig. 2. Changes in intracellular K+ and Na+ concentrations with time in Tyrode’s solution.
Abscissa: time of incubation in Tyrode’s solution. Ordinate: intracellular K+ and Na+ concentrations (mEq/kg of fiber weight) in left atria at rest (open circles) and activity (closed circles). Each point represents 10 to 15 atria. Vertical lines are the standard errors of the mean. There were significant differences in K+ concentrations between resting and contracting atria at 30 minutes and significant differences in Na+ concentrations at 30, 60 and 120 minutes.
Therefore we obtained the interstitial space volume by extrapolation of the slow component to zero time, giving a figure of 22 ml/100 g of tissue (fig. 1).
Some factors controlling intracellular K+ and Na+ in isolated atria. The average intracellular K+ concentration calculated from 10 fresh atria (immediately after removal from the rabbit and before incubation in Tyrode’s solution) was 60.2 ±2.1 (S.E.) mEq/kg and the Na+ concentration 19.1 ± 4.3 mEq/kg of fiber weight. Figure 2 shows that quiescent and contracting atria lost K+ and gained Na+ in Tyrode’s solution. After 1 hour the K+ concentration in quiescent atria was 53.4 ± 2.0 mEq and after 2 hours 46.6 ±2.1 mEq/kg of fiber weight. Na+ concentration after increasing to 34.6 ± 5.9 mEq in the first half hour remained constant thereafter. At the end of the first hour these changes resulted in an
approximate 2:1 ratio (15.5:6.8) of sodium gained to potassium lost and at the end of the second hour this ratio was approximately 1:1 (15.5:13.6).
Rabbit atria contracting at a rate of 4.0 beats per second lost K+ rapidly in the first hour (fig. 2). At the end of the first hour intracellular K+ was 46.8 =fc 3.2 mEq/kg of fiber weight and at the end of the second hour 43.3 H 1.1 mEq. Intracellular Na+ concentration in contracting atria increased during the first half hour significantly more than in resting ones to 55.7 =t 3.2 mEq/kg of fiber weight and remained at this level for the remaining 90 minutes. The ratio of Na+ gained to K+ lost was approximately 3:1 (36.6:13.4) after 1 hour and about 2:1 (36.6:16.9) after the second hour.
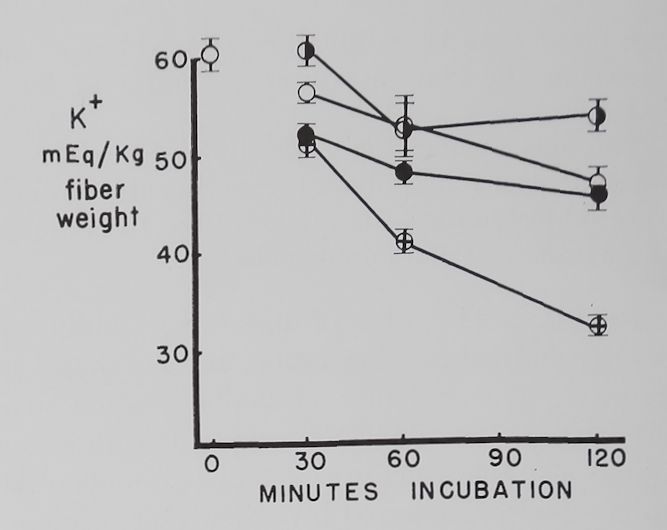
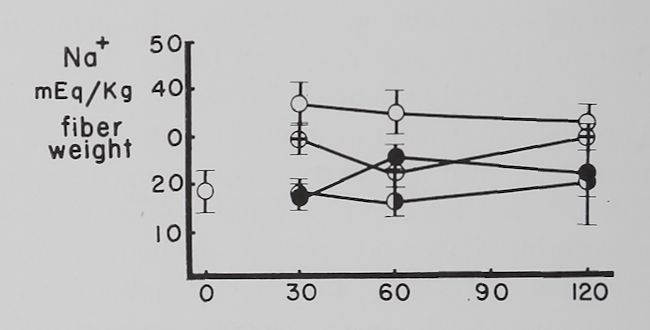
The effect of different concentrations of ouabain on the K+ and Na+ concentration in resting atria. Figure 3 shows that 10-7 M ouabain prevented the decrease in K+ concentration in the first 30 minutes, and K+ was at a level above the controls at the end of 120 minutes. During the first 60 minutes the rapid increase in intracellular Na+ concentration observed in the controls was also prevented by 10“7 M ouabain. Atria exposed to 10-6 M ouabain had, in comparison to the controls, similar K+ and Na+ concentrations at 120 minutes. Increasing the ouabain concentration to 10~5 caused a rapid and progressive decrease in intracellular K+ concentration. Intracellular Na+ concentrations in the 10-5 M ouabain group were not significantly different from the controls.
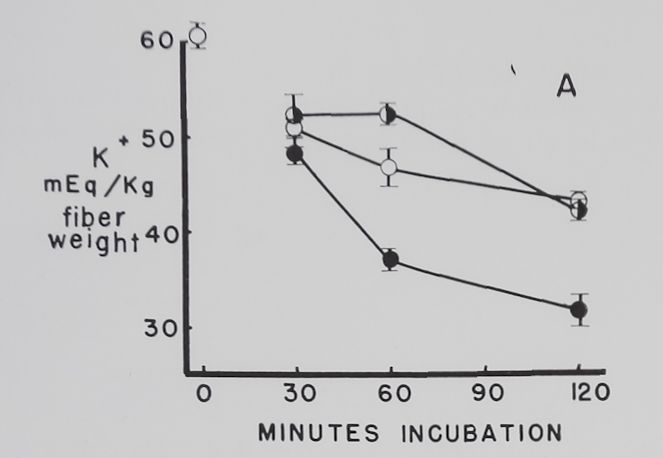
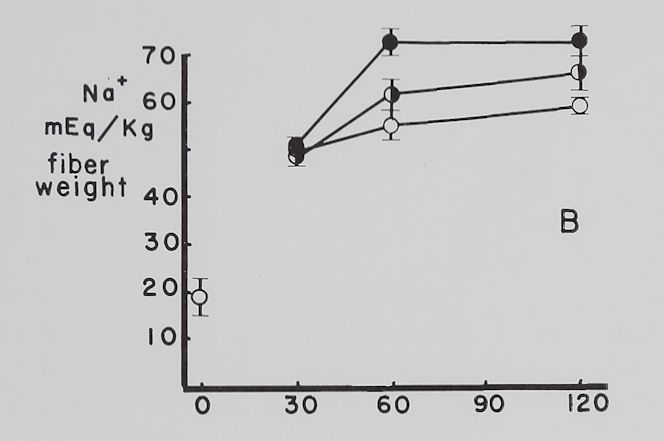
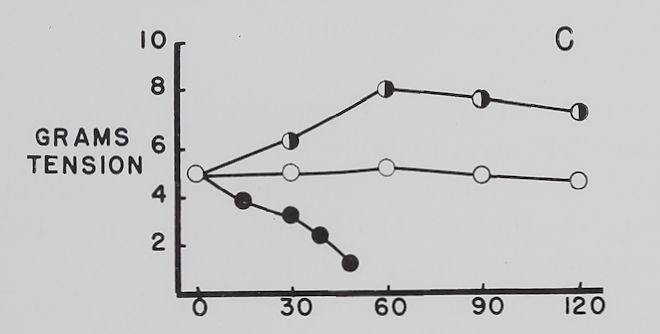
The effect of ouabain on the Na+ and K+ concentration in atria contracting at a rate of 4-0 beats per second. Figure 4 summarizes the data obtained with “therapeutic” (5 X 10“8 M)—a concentration which increased contractility—and “toxic” (10~6 M)—a concentration which decreased contractility—amounts of ouabain. The control curves show that with time the atria lost K+, gained Na+ and contractility was not significantly changed all through the experimental period. Ouabain, 5 X 10~8 M, increased contractility by about 50 to 60 per cent, decreased K+ loss at the time maximum inotropic effect was reached and had no significant effect on the increase in intracellular Na+. With 10“6 M ouabain, contractility rapidly declined and K+ loss was accelerated, while the gain in Na+ was significantly increased at the 60-minute point. It is to be noted that after 30 minutes’ exposure to 10~° M


Fig. 3. Effect of three different concentrations of ouabain on intracellular K+ and Na+ concentrations in quiescent atria.
Abscissa: time of incubation in Tyrode’s solution in minutes. Ordinate: intracellular K+ and Na+ concentrations (mEq/kg fiber weight). Open circles: controls; half circles: 10“7 M ouabain; solid circles: 10~6M ouabain; crossed circles: IO-5 M ouabain. Each point represents 10 to 15 atria and the vertical lines the standard errors of the means. Significant K+ concentration differences are between 10“7 M ouabain and controls at 30 and 120 minutes, between 10“6 M ouabain and controls at 30 and 60 minutes, and between 10-5 M ouabain and controls at 30, 60 and 120 minutes. Significant differences between control Na+ concentrations and 10-7 M ouabain are at 30 and 60 minutes and 10~6 M ouabain at 30 minutes.
ouabain contractility had declined by about 25% while intracellular Na+ and K+ were essentially the same as those found in the control auricles.
The effect of ouabain on the heart in situ. Adult anesthetized rabbits showed indications of “toxic” effects of ouabain after receiving 0.20 to 0.250 mg of ouabain/kg over a period of 90 to 120 minutes. Toxicity was indicated by a fragmentation of the QRS segment and by sustained periods of ventricular extrasystoles. The injection of about 50% of the above dose (0.100 mg/kg) over a period of 105 minutes into 11 rabbits produced a slowing of heart rates and a slight pro-


Fig. 4. Effect of two concentrations of ouabain on intracellular K+ and Na+ and contractility of atria contracting at 4.0 beats per second.
Abscissa: time of incubation in Tyrode’s solution. Ordinate A: intracellular K+ (mEq/kg of fiber weight). Ordinate B: intracellular Na+ (mEq/kg of fiber weight). Ordinate C: grams tension developed by the same atria as in A and B. Open circles: controls; half circles: 5 X 10″8 M ouabain; solid circles: 10”6 M ouabain. Each point represents 10 to 15 atria and the vertical lines represent the standard errors of the means. Significant differences are between control and both ouabain groups in A at 60 minutes and between control and 10″6 M ouabain at 120 minutes. There is also a statistically significant difference between 10″6 M ouabain and control in B at 60 minutes.
longation of the PR interval. In order to verify that this was similar to a “therapeutic” dose, heart failure was produced in the open-chest rabbit by a constant infusion of pentobarbital (3 mg /kg /minute) and direct measurements of cardiac contractility made during the production of failure as described in Methods. These rela-
tively crude measurements indicated that the infusion of 0.025 mg of ouabain/kg increased the force of contraction of the pentobarbital-depressed heart by about 50%. Rabbits receiving saline during the injection periods showed no changes in the ECG or in cardiac contractility measured in situ. Table 1 shows the results of analysis of portions of the rabbit myocardium for water, K+and Na+ concentrations. In the saline control animals the right atria had significantly lower K+ concentrations and higher Na+ than the other parts of the heart. Ventricular K+ concentrations in the controls were higher than the atrial concentrations. The sodium values in the ventricular tissues were calculated with correction for 22% interstitial space. This is the value obtained from atrial measurements and may therefore introduce an error into the ventricular sodium values. However, since total tissue water content in atria and ventricles was similar (table 1), this interstitial space error may not be large.
The data in table 1 show that when compared to the saline controls, amounts of ouabain which produced severe alterations in the ECG did not produce a significant loss of K+ or gain of Na+by the myocardium. The intracellular K+ concentrations in myocardium from rabbits receiving 50% of the “toxic dose” (a “therapeutic dose”) were not changed while intracellular Na+ ion concentrations in the ventricles were significantly lower than in controls.
Discussion. The accurate determination of the volume of the interstitial space is essential for quantitative measurements of the intracellular ion concentrations. Values for this space range in the literature from 20% (Harris, 1956) to 44% (Rayner and Weatherall, 1957) which suggests that individual animal variations may be large or that the methods and interpretations differ (Conway, 1957). No studies on myocardial interstitial space in different animals have been made using the same technique in all cases. Rayner and Weatherall (1957) obtained a value of 44% for atrial interstitial space with the inulin method while we obtained a value of 22%. This indicates that there may be a different interpretation of the relationship between inulin and interstitial space. A rapid and slow increase in inulin space was observed in our experiments and similar results have been obtained by other investigators (Danielli and Davson, 1941; Nichols et al., 1953; Cotlove, 1954). By considering the total inulin
TABLE 1
Effect of ouabain on K+ and Na+ in rabbit myocardium in situ Results of analysis for intracellular K+, Na+ and tissue water in rabbits receiving different amounts of ouabain. Ouabain administered i.v. at different dose levels of 0.025 mg/kg/30 min (“therapeutic dose”) and 0.050 mg/kg/30 min (“toxic dose”).
| Tissue | No. of Observations | Type of Infusion | Water Content’% | K+ ± S.E. | Na+ =fc S.E. |
| mEq/kg fiber weight | |||||
| Right atria | 10 | Control (saline) | 63.2 d= 3.2 | 41.8 dz 2.2 | |
| Left atria | 10 | Control (saline) | 84.3 dz 0.7 | 71.2 dz 3.8 | 31.2 dz 3.6 |
| Right ventricles | 10 | Control (saline IL*: | 79.0 dz 0.7 | 79.5 dz 2.8 | 23.7 dz 2.3 |
| Left ventricles | 10 | Control (saline) | 80.8 dz 0.8 | 79.6 dz 2.3 | 22.1 dz 2.9 |
| Right atria | 11 | Ouabain (0.100 mg/kg) | 64.5 dz 1.6 | 34.2 dz 3.8 | |
| Left atria | 11 | Ouabain (0.100 mg/kg) | 82.9 =fc 0.1 | 69.4 dz 2.5 | 24.5 dz 3.3 |
| Right ventricles | 10 | Ouabain (0.100 mg/kg) | 77.9 dz 1.0 | 78.7 dz 1.8 | 13.0 dz 2.5* |
| Left ventricles | 11 | Ouabain (0.100 mg/kg) | 79.5 dz 0.6 | 80.3 dz 2.4 | 13.9 dz 2.5* |
| Right atria | 11 | Ouabain (0.200-0.250 mg/kg) | 57.1 dz 2.7 | 39.1 dz 3.3 | |
| Left atria | 11 | Ouabain (0.200-0.250 mg/kg) | 83.6 dz 0.8 | 72.6 dz 2.6 | 27.2 dz 4.6 |
| Right ventricles | 11 | Ouabain (0.200-0.250 mg/kg) | 78.7 dz 0.8 | 78.5 dz 3.3 | 28.6 dz 3.4 |
| Left ventricles | 10 | Ouabain (0.200-0.250 mg/kg) | 81.1 dz 0.7 | 80.9 dz 3.2 | 27.8 A4.9 |
* Indicates statistically significant difference from saline controls (P < 0.01).
space as representative of the interstitial space volume one can obtain a figure of 42% (at 2 hours) for the interstitial space in rabbit atria (fig. 1). There are two reasons for not accepting this as the true interstitial space. There is evidence that the slow component may continue to increase until inulin space volume equals total water volume (Finkenstaedt et at., 1952). This suggests that there is an adsorption of inulin on or a slow diffusion into cells. The calculation of intracellular Na+ concentrations on the basis of 42% interstitial space often results in zero or negative values which is contrary to other evidence.
Our values for the intracellular potassium ion concentration in rabbit atria in vitro are lower than those reported by other investigators (Rayner and Weatherall, 1957; Holland et al., 1959). The method of calculation (in mEq/kg of fiber weight) and the figure used for the interstitial space volume (22%) will give different values for the intracellular cation concentration. However, when calculated on the basis of mEq/kg of dry weight we obtain a value of 313 mEq, Rayner and Weatherall 374 mEq, and Holland et al. 448 mEq so that other factors such as animal variation and seasonal changes might be responsible for the difference in intracellular
K+ concentration. Comparison of values for fresh left atria in table 1 (71.2; winter rabbits) with those on page 283 (60.2; summer rabbits) suggests that seasonal variations are important considerations in such studies.
The experiments presented here have shown that isolated atria suspended in Tyrode’s solution lose K+ and gain Na+, and do not show a significant change in contractility.
The effects of ouabain on intracellular ion concentrations are dose-dependent. Thus low concentrations which produced a significant positive inotropic effect either increased or did not change intracellular K+ and Na+ concentrations. Higher concentrations of ouabain which produced a severe defect in contractility and excitability eventually decreased intracellular K+ and increased the Na+ concentration. However, the effects of ouabain on ion concentrations were not causally related to the changes in contractility (see fig. 4); they followed rather than preceded them.
Similar supporting data were obtained in the experiments on intact rabbits. Doses of ouabain which produced severe alterations and irregularities in the ECG (“toxic changes”) produced no significant changes in intracellular K+ or Na+ concentrations. The “therapeutio dose” of oua-
bain (50% of the “toxic dose”), although reducing ventricular Na+ concentrations, produced no change in myocardial K+ concentration. Hajdu and Leonard (1959) have postulated that “potassium loss is causally related to the increase in contractility.” Our data thus in no way support such a hypothesis. However, our data do confirm the recent work of Blackmon et al. (1960) who found that in the intact digitalized dog the appearance of changes in the ECG corresponds more exactly with the attainment of potassium balance than with potassium loss by the myocardium.
It is to be noted that we have confirmed older findings that ouabain in high concentrations decreases intracellular K+ and increases Na+ concentrations. However, it is apparent that these ion changes are not concomitant with either contractile or electrical changes. They may be related to the contracture or the uncoupling of oxidative phosphorylation produced by ouabain (Lee et al., 1960). Our observation that net decreases in K+ concentration are not associated with the positive inotropic effect does not rule out the possibility that a redistribution of intracellular K+ occurs during ouabain exposure.
SUMMARY
In the isolated or in situ myocardium the positive inotropic effect of ouabain was associated with an increased or unchanged K+ concentration while Na+ was not significantly changed. Higher concentrations of ouabain decreased tension in the isolated heart and produced irregularities in the ECG of the intact rabbit. Intracellular K+ was unchanged in the intact rabbit myocardium and decreased only after the negative inotropic effect appeared in the isolated myocardium. These results suggest that changes in contractility produced by ouabain are not related to changes in intracellular K+ or Na+ concentrations. The Hajdu hypothesis of a causal relationship between intracellular K+, Na+ and contractility is
not supported by our experiments because alterations in intracellular K+ follow rather than precede the inotropic effects of ouabain. A relationship between K+ loss and the uncoupling of oxidative phosphorylation may be indicated since Lee and co-workers (1960) have reported that increased oxygen uptake also follows rather than precedes the “toxic” effects of ouabain on contractility.
REFERENCES
Blackmon, J. R., Hellenstein, H. K., Gillespie, L. and Berne, R. M.: Circulation Res. 8: 1003, 1960.
Boyer, O. K. and Poindexter, C. A.: Amer.
Heart J. 20: 586, 1940.
Conway, E. J.: Physiol. Rev. 37: 84, 1957. Cotlove, E.: Amer. J. Physiol. 176: 396, 1954. Danielli, J. F. and Davson, H.: J. Physiol.
100: 246, 1941.
Finkenstaedt, J. T., O’Meara, M. P. and Merrill, J. P.: J. clin. Invest. 31: 627, 1952. Fisher, R. A.: Statistical Methods for Research Workers, 12th ed. rev., pp. 122-128, Hafner Publ. Co., New York, 1954.
Hagen, P. S.: This Journal 67: 50, 1939.
Hajdu, S. and Leonard, E.: Pharmacol. Rev.
11: 173, 1959.
Harris, E. J.: in Transport and Accumulation in Biological Systems, Academic Press, New York, 1956.
Holland, W. C., Klein, R. L. and Briggs, A. H.: Amer. J. Physiol. 196 : 478, 1959.
Kühns, K.: in Herzinsuffizienz und Digitalis-wirkungen, p. 108, Springer-Verlag, Berlin, 1959. Lee, K. S., Schwartz, A. and Burstein, R.: This Journal 129: 123, 1960.
Nichols, G., Jr., Nichols, N., Weil, W. B. and Wallace, W. M.: J. clin. Invest. 32: 1299, 1953. Rayner, B. and Weatherall, M.: Brit. J.
Pharmacol. 12: 371, 1957.
Sanyal, P. N. and Saunders, P. R.: This Journal 122: 499, 1958.
Schatzmann, H. J.: Helv. physiol, acta 11: 346, 1953.
Schatzmann, H. J. and Witt, P. N.: This Journal 112: 501, 1954.
Schreiber, S. S.: Amer. J. Physiol. 185: 337, 1956. Schreiner, G. F.: Proc. Soc. exp. Biol., N. Y.
74: 117, 1950.
Vick, R. L. and Kahn, J. B., Jr.: This Journal 121: 389, 1957.
Wedd, A. M.: This Journal 65:268,1939. WlLBRANDT, W., BRAWAND, K. AND WlTT, P. N.: Arch. exp. Path. Pharmak. 219: 397, 1953.
