Images Collection
Read OCR Digitized Article Text
NOTE: This plain text article interpretation has been digitally created by OCR software to estimate the article text, to help both users and search engines find relevant article content. To read the actual article text, view or download the PDF above.
Httl.WlOK.M AND Nl’URAl BIOLOGY 26, 132-160(1979)
Measurement of Spatial Behavior: Methodology Applied to Rhesus Monkeys, Neon Tétras, Communal and Solitary Spiders, Cockroaches, and Gnats in Open Fields
J. Wesley Burgess1
Research Section, Box 7532, North Carolina Division of Mental Health and Mental Retardation Services, Raleigh, North Carolina 276112
The comparison of spacing patterns between animal groups is made possible by a methodology which uses the following steps: Members of a group are photographed from above, animal position coordinates are extracted from photographs, and 10 objective measures of distance or distribution are computed. Six groupliving species with different life-styles were compared in replicate groups: rhesus monkeys, neon tetra fish, communal spiders Mallos gregalis, funnel web spiders Agelenopsis utahena, American cockroaches, and eye gnats. Groups of 25 individuals were released into open-field arenas scaled to the animals’ size. Photographic intervals were computed according to the motility of each species. Spacing measures were contrasted between replicate groups and each species was compared to an inanimate control model. Every species showed significant active spatial behavior in three or more measures. Replicates adhered to general species patterns and some group-typical spacing values were found. Three general patterns of spacing were present: spatial subgroups of 3-4 members in monkeys and communal spiders (most interactive groups); more homogeneous, significant aggregation in neon tétras and cockroaches (less interactive groups); and uniform distance spacing in funnel web spiders and eye gnats (predominantly solitary life-style). Applications for future studies, behavioral mechanisms, and group spacing theory are discussed.
What is the phenomenon in group-living animals which is called “sociality,” and how can social systems of different species be compared? Theorization or heuristic analysis does not provide very satisfying answers to these questions. Observations and experimentation on many different species cannot dimply be lumped together into a composite called social behavior. Group-living adaptations take more diverse forms
1 The author acknowledges support from NSF grant BMS-75-00915 to P. N. Witt and from the N. C. Foundation for Mental Health Research, Inc. Sincere appreciation is due P. N. Witt and Rubenia Daniels for their aid. Mr. Wes Burgess, Sr., helped with the photographs. 2Present address: Department of Psychology, University of California, Davis, Calif. 95616.
132
0163-1047/79/060132-29$02.00/0
Copyright © 1979 by Academic Press, Inc.
All rights of reproduction in any form reserved.
MEASUREMENT OF SPATIAL BEHAVIOR
133
in different animals and the behavioral scientist must admit the possibility that each genus, species, or individual animal group may have its own unique social pattern which cannot be practically compared with that of any other animal’s. It is also known that systems with many interacting variables (such as groups of animals) often behave counter-intuitively (Waddington, 1977) so that reasoning by deduction or inference may be misleading.
To move in the direction toward answering general questions about sociality it would be good to find ways in which animal groups (of the same or different species) can be objectively compared, and to pose some hypotheses about social mechanisms. This paper serves two functions. First, it introduces a method which compares groups according to the arrangement, distances, and distribution of their members, i.e., group spacing. By providing detailed descriptions of data collection, analysis, and evaluation procedures, it is hoped to make the method available for the study of spatial behavior in animal groups under a wide range of conditions. A unique feature is that data are taken from groups in the form of photographs, and the recorded animal spacing is translated into distances and numerical models with a minimum of prior hypotheses about how the subjects are expected to behave.
The paper’s second function is to provide the results of one set of experimental comparisons of spacing configurations in six species which live in permanent or temporary groups. Spacing is a convenient dimension to study because it is spontaneous (i.e., groups do not require prior training by the investigator) and can be measured in any grouped species. If a spacing approach is to be useful it should identify active spatial behavior, determine if grouped individuals show any significant, communal responses, and distinguish between species and groups which have different spacing configurations. Species with different life-styles were chosen for comparison: two group-living vertebrates (monkey troops and schooling fishes), two arachnids found in groups (communal and solitary spiders), and two group-living insect species (congregating cockroaches and dispersing gnats). The objectives in comparing these animals can be stated in a social spacing hypothesis:
1. All group-living beings will, when released in moderate numbers into a relatively large open arena, actively assume a pattern of distribution which is different from non-group-living beings; the pattern can be modeled mathematically.
2. A spatial pattern will be predictable and characteristic for a species at some level, where it will be the same for different members of the same species at different times; this can be tested statistically.
3. Different species with different life-styles will show different patterns of spacing if tested under comparable conditions; such patterns can be interpreted as one aspect of their level of sociality.
134
J. WESLEY BURGESS
1 METHODS
1.1 Data Collection
Subject animals. Rhesus monkeys, Macaca mulatto, were members of naturally formed, free-ranging troops of about 25 individuals caught and placed in enclosures at the Caribbean Primate Research Center in La Parguera, Puerto Rico (Fig. 1; Witt, Burgess, Phoebus, & Weisbard, in preparation). Groups contained male and female adults and juveniles. Observations were made on group I from Novemfoerfsjg through December 6,1975. Groupjj| Äl^Bwirv^d during April ||jjÉ6, 1976 and again during April 5-8, 1977 (designated group III). Rhesus monkeys hftjpbeen observed living in groups @|^|50 members adult males are generally dominant. Groups ff||l defend a.territorial arilf from Äer conspecific troops, but close distances are maintained wjth|§|the group itself. Qyerail patterns offpfliai,distribution show characteristic qualitarif^differences ^between several genera of nonhuman primates (Carpenter, 1964). j.. Communal Hfppiders, Simon (familyp|äictynidae),
p^eregaken from a natural hear Guadalajara, Mexico (Burgess,
1976; 1978) and raised in laboratory colonies. Controlled laboratory, con-Srditions for these and subsequent were : temperature
humidity IwêmSË^ l|«p9 hr D photoperiods. Subjegjjji Were taken from ,^\|%|ep^ate and transferred to Pyrex arenas (shown inMfcy
Each group contained adult females, juveniles* and one adult male. Ill %iboratory ^)oniës^MygMgMfy keep close djstanttes and build webs,-catch orevÆamfMM^mâ-rsLise offspring communally, ejpjpnçe that c$j«aflfe ||fens are close to natural (Diguet, 19Ö9; Burgess & Wilt, l||7((). * ,
: .c Neon tetra &les, //vn)te.yB^^M^^^^^^^M^ CharacinidaeV^^fji’ -taken from commercial aquaria populations and kept in tanks jiiitil
they were tested. Groups contained adults of both sexes (Fig. 3). Neon Jetras are native» tropical waterways of Brazil and Peru (Mager jk Mager, 1961). Adults school in groups and reproduce^by laying adhesive eggs which Äfceive no parental £afe. Fish Sijf|^j§ls.are a popular subject for spacing studies (Shaw, ^970; 1978; Pitcher, i^f2|jand schooling is considered a simple social beha^çrfor avoiding predation (Wilson, 1975).
American cockroaches, PeffifaifeM..Americana Linné (family Blit-tidae), were drawn from a large rearing colony maintained under controlled conditions. Groups contained ad|tt§ and juveniles of both sexes (Fig. 4). American cockroaches are highly gregarious insects found in human habitations worldwide (James & Harwood, 1969). Males of this species are not territorial but may form transitory, variable social hierarchies, according to Bell and Sams (1973).
Funnel web spiders, Agelenopsis utahena, Chamberlin and Ivie (family Agelenidae), were collected from bushes in Raleigh, N.C., during August 25 and September 9, 1977. Most of the individuals in a group came from
MEASUREMENT OF SPATIAL BEHAVIOR
135

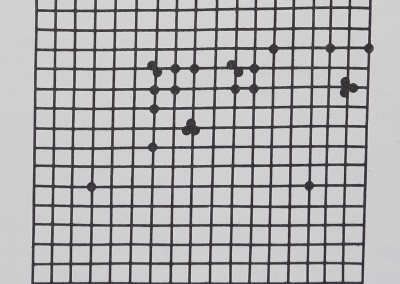
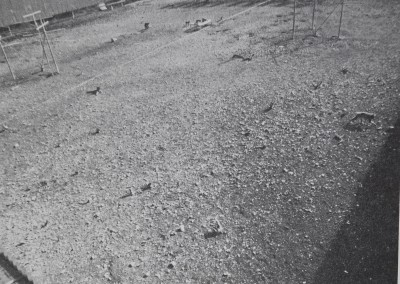
Fig. 1. (a) The distribution of a group of rhesus monkeys, Macaca mulatto, in an outdoor enclosure. Tangential overhead view shows monkeys, walls, floor, and interior of enclosure. Arena area = 930 m2; the animals’ lengths are about lm. (b) The monkey arena as seen by the computer, corrected for the wide angle of the photographic lens. Each dot is a monkey’s position. In this typical spacing pattern most monkeys are near several conspecif* *cs, but the entire group is not clumped closely together. The grid is precise to ±0.75 m.

J. WESLEY BURGESS
136

Fig. 2. The^S^irtion of a group of communal web in an
experimental arena. TÿM’&Mmtéiâ sbid&rs.j a numbered grid, flies, and White
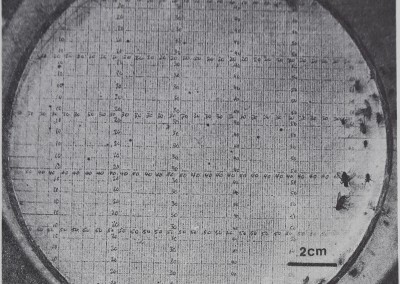
patches of’ftenS® web. In;4fill§i|pical Spacing -pattern m^8.jlÿ|oéïs are near one op more Jftnspecifics bût t,l|^epti^Ê group is not clumped together. Compare t<|ij spacing with the solitary spiders.pi^if^yiii’iFig. 5. Arena^ar^ ~=^Æ.èianimalsMgngths-cm. The grid ißiftécls’e,.„
websr‘close to each other. The d\ÿo groups contained adult females, juveniles, and five to seven adult males, ,1ft F^gt $|Chis species is
common in bushes”; and shrubs throughout tin eastern United States (Chamberlin & Ivie, 1944)j.JÀdultS livé aîéné tftlwéhs which may be far apart or close together. Early îftj the year spiderlings are found in a group on the maternal web (author’s unpublished data).
Eye gnats, Hippg(^0 puisioLowe (fejnily Chloropidae), were taken in groups from large rearing colonies which were maintained under controlled conditions. Adults of both sexes were divided into the experimental groups pictured in Fig. 6. Jîye gnats are abundant in cultivated areas (Burgess, 1951) and are commonly Wound congregated around domesticated animals. Eye gnats disperse rapidly over wide areas under natural conditions (Dow, 1959).
Procedures. Animals were placed into arenas where they remained throughout the experiment. Arena areas were proportional to the animals’ size in a ratio 30.5:1 = area*: mean body length of subjects; actual dimensions are given in Figs. 1-6. Animals were allowed to move freely in
MEASUREMENT OF SPATIAL BEHAVIOR
137

Fig. 3. The distribution of a group of neon tetra fishes, Hyphessobrycon innesi in an experimental arena. Close distances and orientation with conspecifics are characteristic of schooling behavior. The grid and circular mesh arena wall are submerged in 39 liters of water (at 25°C) to a depth of 4 cm. Arena area =p2827 cm; the animals’ lengths are 2.0-1.5 cm. The grid is precise to ±1 cm.
their arenas. For the rhesus monkeys and the communal web spiders it was known that the groups stabilize over time. Monkeys were allowed several months and the communal spiders 11 days to adjust to their arenas. For the other species it was judged sufficient to allow 1 hr before the first data collection. The lack of significant trends in the spacing data during the experiment is evidence that all groups were in a constant or relatively steady state.
Control. To distinguish active aggregation or dispersion from fortuitous configurations of animals, some previous studies have compared interanimal distances with distances between randomly dispersed points, e.g., from Clark and Evans (1954), Thompson (1956) or Pielou (1977). However, random points do not allow for the relative size and shape of an arena or the number of animals in a group which may influence spacing without active behavior by the subjects (for example, animals may collect near a wall or near other conspecifics which obstruct their path; these should not be considered interactive or communal responses). Examples of this sort of passive or mechanically caused spacing were seen by Henson (1961) in scolytid beetles. For the present study, two test groups
J. WESLEY BURGESS
138

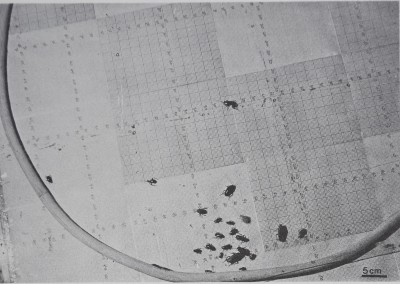
Fig. 4. The distribution of a group of American cockroaches, Periplaneta americana, in an experimental arena. Only the section of the arena containing the animals is pictured. Note that all individuals are aggregated into one clump and there is much contact; compare to Fig.
3. If disturbed, the whole group flees; otherwise single animals leave to explore the arena and then return to the group. Arena area = 6316 cm2; the animals’ lengths are 3.5-1.0 cm. The grid is precise to ±1 cm.
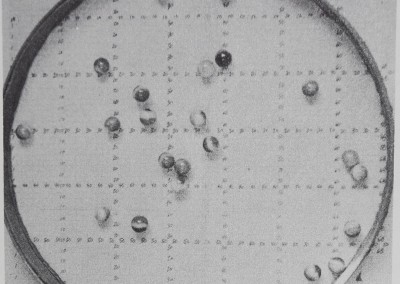
consisting of inanimate model subjects were observed under conditions comparable to the animal groups. The model subjects were spherical marbles which were dropped into a prepared arena and allowed to rebound in every direction, off the wall and off each other, to provide a model of passive spacing under experimental open field constraints (Fig. 7). Since the marbles were nearly the same size as the funnel web spiders, the same arena was used (Figs. 4 and 7), but it was prepared with a floor of smooth plate glass which was leveled and padded so that a single dropped marble landed without bouncing or rolling. Both groups of 25 marbles were dropped one at a time from a height of 60 cm into the center of the arena and were dispersed in every direction, colliding with each other and with the arena wall. A different participant dropped each group of marbles 10 times. Every time the marbles came to rest, a photograph was taken. When the data photographs were inspected, there was no prevalent concentration of marbles in the center, periphery, or in any quadrant of the arena. Slide evaluation and data analysis then proceeded the same as for animal groups.
Photography. Arenas were photographed from above with a 35-mm
MEASUREMENT OF SPATIAL BEHAVIOR
139

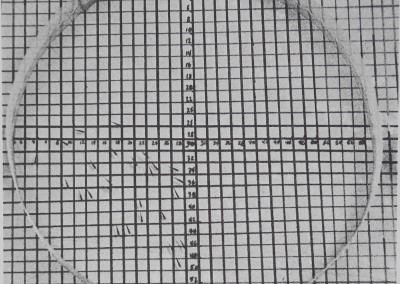
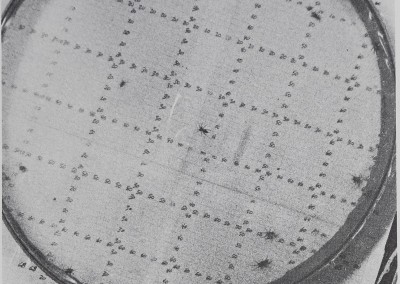
Fig. 5. The distribution of a group of funnel web spiders Agelenopsis utahena in an experimental arena. The spiders are dispersed uniformly across the arena and there is no contact between individuals. The long distances shown here are not uncommon for this species in natural habitats. Arena area St 962 cm2; the animals’ lengths are 1.1-0.6 cm. The grid is precise to ±0.25 cm.
SLR camera (Nikon F2). The use of high quality lenses assured freedom from significant distortion. Monkeys were photographed with a 21-mm wide-angle lens to increase coverage; the wide-angle perspective was corrected during evaluation by using a converging grid applied to the projector screen.
The mobility of the animals varied enormously from species to species. Neon tétras and eye gnats moved constantly and most rapidly, monkeys and funnel web spiders occasionally moved quickly, while the communal web spiders moved infrequently and slowly. Intervals of photography were chosen to allow movement in 90-100% of the animals in a group. If active spacing patterns exist in any species, the most critical data collection interval should be one where all members have had an opportunity to respond to their conspecifics’ positions. The method of determining inter-
J. WESLEY BURGESS


MEASUREMENT OF SPATIAL BEHAVIOR
141

Fig. 7. The distribution of marbles dropped into an experimental arena. Note that many of the marbles have come to rest near or touching a wall or another marble. Comparison of many photographs showed that marbles did not collect more often in the center, periphery, or in any quadrant of the arena. A marble model allows comparison of passive distribution in the experimental environment to the spacing of interacting animals. Arena area = 962 cm2; the marbles’ diameters are about 1 cm. The grid reads precise to ±0.25 cm.
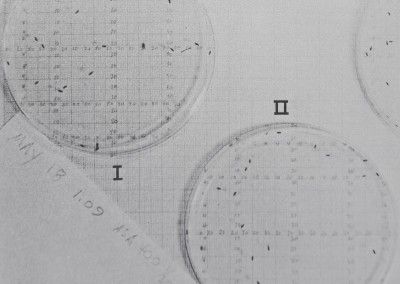
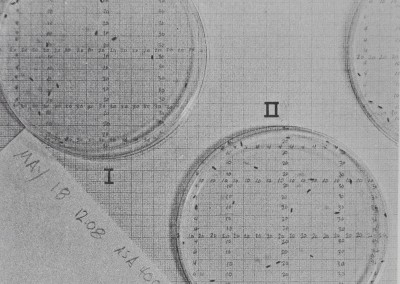
Fig. 6. The distribution of two groups of eye gnats Hippelates pusio in photographs taken 1 hr apart. For group II in 6(b) a movement coefficient can be computed by comparing the record of animals’ (x,y) coordinate positions which were evaluated from the photographs. (a) II. 12:08 pm, animal coordinates: (02,21) (04,13) (04,15) (07,08) (07,28) (07,31) (11,14) (11,34) (12,04) (14,32) (14,08) (17,26) (20,03) (21,16) (24,12) (25,10) (25,24) (25,36)
(25.37) (27,03) (27,25) (29,16) (29,25) (32,10) (38,16). (b) II. 1:09 pm, animal coordinates:
(07,12) (04,23) (11,09) (11,19) (12,07) (12,25) (13,09) (13,29) (15,02) (15,23) (17,02) (17,37)
(19.38) (24,05) (25,36) (26,06) (28,36) (29,36) (30,34) (32,10) (33,07) (33,37) (34,23) (35,10)
(37,34). Similar coordinate data were used to calculate all spacing measures. The number of coordinates different in the second photograph is the minimum number of animals which have moved from their positions in 1 hr. Only the animals’ positions at (25,36) stayed the same. Movement coefficient = number of moves x 100/group size = 24 x 100/25 = 96%. Arena area = 56 cm2; the animals’ lengths are 0.25-0.15 cm. The grid is precise to ±0.12 cm.
142
J. WESLEY BURGESS
vais is explained in Table 1 and Fig. 6. Data collection intervals from the monkeys were fixed at 2 sec and 24 hr. Neon tétras were sampled at the 2-sec interval. One-hour and 24-hr intervals were tried for the funnel web spiders and the 1-hr interval was used for eye gnats and American cockroaches. Communal web spiders were observed at the 24-hr interval (Table 1).
Photographs (on Kodak Tri-X Pan or Ektachrome-X film) were mounted in slide frames and then were projected onto a screen in the laboratory. The numbered grids on the floors of the experimental arenas were used to calculate animal positions, except for the monkeys, where a perspective-correcting grid was superimposed onto the projection screen. Coordinates (x,y) of each animal’s position on the grids were recorded on data sheets (Fig. 6). Réévaluation checks were made by comparing a previously recorded slide to the data sheet. The precision of each of the evaluation grids is given in Figs. 1-7. The American cockroach slides (each of which required 10-15 min to record) were judged the most difficult to evaluate. Therefore, the 10 cockroach slides were reevaluated, recorded, repunched, and again analyzed in the computer for three measures to test the accuracy of the entire process. The resulting differences were: mean first nearest neighbor distance 0.11 cm (2.8% error); overall mean distance, +0.33 cm (2.4% error); and personal space distribution, —0.13 cm (1.4% error).
TABLE 1
Movement Coefficients for Six Species at Different Intervals®
| Species | SampleInterval | Group I | Group II | ||
| X | SE | X | SE | ||
| Rhesus monkeys | 2 sec | 9.2 | 2.5 | 6.2 | 1.9 |
| (Macaca mulatta) | 24 hr | 90.6 | 2.1 | 88.8 | 3.8 |
| Communal web spiders | 24 hr | 97.6 | 1.1 | 96.4 | 1.3 |
| (Mallos gregalis) | |||||
| Neon tetra fishes | 2 sec | 100.0 | 0 | 99.56 | 0.4 |
| (Hyphessobrycon innesi) | |||||
| American cockroaches | |||||
| (Periplaneta americana) | 1 hr | 96.2 | 1.2 | ||
| Funnel web spiders | 1 hr | 82.8 | 3.0 | 66.3 | 8.7 |
| (Agelenopsis utahena) | 24 hr | 98.4 | 0.8 | 99.0 | 0.7 |
| Eye gnats | 1 hr | 97.0 | 2.0 | 99.6 | 0.4 |
| (Hippelates pusio) | |||||
“ Movement coefficient is a percentage of the animals who change positions during a given time interval (see Fig. 6). Intervals were chosen to allow a movement coefficient of 90-100%, so that nearly all the animals had a chance to respond to a change in conspecifics’ positions. Movement coefficient shows minimum movement and does not count any unusual cases where animals exchange positions or return to exactly the same coordinates between pictures. Mean ( X) and standard error (SE) of = 10 observations.
MEASUREMENT OF SPATIAL BEHAVIOR
143
Experimental design and its limitations. All experiments were done in an open field condition, i.e., a standardized environment where most irregular sensory features were removed. These experimental conditions are easy to duplicate for different groups and they make these findings somewhat more comparable with other group distance studies under featureless, laboratory conditions (e.g., Breder & Roemhild, 1947; Williams, 1964; Desforges & Wood-Gush, 1975). Another reason for providing a standardized environment is to compare differences in the behavior of different species under a similar setting. Use of the open field, however, sacrifices the chance to draw direct conclusions about species’ behavior under natural conditions; this compromise will be discussed later. The actual experimental environment does not prohibit animals from employing a wide range of behaviors which are seen in social contexts, such as displays, vocalizations, substrate vibrations, physical contact, and modification of the environments (by excretion, web building, etc.).
Because any walled enclosure poses a restriction to movement, relatively large arena sizes were used (10-20 times proportionately larger to body length than used in most similar experiments; cf. Syme & Syme, 1973). The two-dimensional data collection procedure ignored any vertical comB ponent of spacing in the animals. For example, upright monkeys are proportionately taller than flat cockroaches; spider webs were built 1-4 cm up the arena walls producing a slight incline in the floor, and so forth. In all cases, each animal’s position was recorded from the grid points directly underneath its head, and the animal was then treated as a point.
Choosing a group’s size is a problem for the experimenter. Because it is difficult to watch several animals at once, many “social behavior’’ studies use only two animals. Since a major goal of this investigation was to examine group behaviors, moderately large groups of 25 were chosen. This group size is within the range naturally found in monkeys, communal web spiders, funnel web spiders, cockroaches, and eye gnats. Good representative data on natural group sizes of neon tetra fish are not available, but groups of 25 appear to behave normally.
The study’s approach is to look for common responses of individuals in group situations (cf. social psychology, Worchel & Cooper, 1976; p. 8). To find the sum of individual responses, every measure contains values for each group member per observation. This approach is different from studies which compare individuals within a group, where interindividual differences, identity, and individual variations are important. The present null hypothesis is that there is no active group behavior, and that patterns of different spatial behavior are not objectively measurable. To refute or support this hypothesis, species groups are compared to one another, and passive spacing measures are used to find active patterns and further compare species. Since there is no chance of marbles responding to each
144
J. WESLEY BURGESS
other actively, the marble model is used as the inactive control. Animals’ spacing measures are called active if they are significantly different from inactive marble control values. No control observations for influence of arena wall, arena sizes, or group size were performed.
The special requirements of large primate groups and the problems of working in a remote area necessitated certain compromises for the study of rhesus monkeys. The square outdoor monkey enclosures were less uniform than laboratory arenas and contained feed boxes, awnings, and pipes on which the animals sometimes climbed. Day-to-day differences in the intensity of the sun were partially alleviated by taking data pictures in the cool morning when the sun was low on the horizon.
1.2 Data Analysis
Coordinate numbers (x,y) form a sequential record of every animal’s position in each observation, beginning with the first animal in the upper left of the arena and ending with the last animal at the lower right (Fig. 6). These number pairs are punched onto IBM cards and are analyzed with the help of a computer program which calculates basic measures. Without a computer, the analysis can be performed by calculator or minicomputer using the steps outlined below.
Distance Measures. Between every two points (x,y; Xi,yi) there is a distance between two neighbors in a group.
Step 1 A. Calculate all neighbors’ distances from coordinates [(x — xi)2 + (yB Yi)2]4–
B. Rank distances from smallest to largest for each group member as shown in Table 2.
C. Compute first row mean which is the 1st nearest neighbors’ mean distance (nnd) == X (closest distances)/n.
TABLE 2
Model Table for Computation of Distance Measures®
| I | II | Group members III IV . . . | n | Distance measures (X) | ||
| All 1st nearest neighbors | a | b | c | d | a | 1st nearest neighbor distance |
| All 2nd nearest neighbors | d | e | f | g | h | 2nd nearest neighbor distance |
| All 3rd nearest neighbors | i | j | k | 1 | m | 3rd nearest neighbor distance |
| All A7th nearest neighbors | m | 0 | P | q | r | nth nearest neighbor distance |
a When all distances (a, b, c . . .) between members of a group have been computed, they are arranged so that every animal’s 1st nearest neighbors are in the first row, all 2nd nearest neighbors are in the second row, followed by 3rd, 4th, 5th nearest neighbors distance rows, and so forth. The row means then equal the mean nearest neighbor distance for that row, and the mean of all rows is the overall mean distance to all neighbors for the group. See text for details.
MEASUREMENT OF SPATIAL BEHAVIOR
145
Step 2 Compute second row mean which is the 2nd nearest neighbors’ mean distance = 2 (2nd closest distances)/«.
Step 3 Compute third row mean which is the 3rd nearest neighbors’ mean distance = 2 (3rd closest distances)/«.
Step 4 Compute fourth row mean which is the 4th nearest neighbors’ mean distance = 2 (4th closest distances)/«.
Step 5 Compute fifth row mean which is the 5th nearest neighbors’ mean distance = 2 (5th closest distances)/«.
Step 6 Compute mean of all row means which is the overall mean distance to all group members = (1st nnd + 2nd nnd + 3rd nnd . . . «th)/«.
Relative Measures. Distribution measure ratios, percentage contact and movement coefficient are computed from all animals’ positions.
Step 7 A. Plot animals’ position coordinates and overlay a grid to test the dispersion (compute grid size with either B or C). Count the number ofjnembers in each square and compute mean per grid square (X) and variance between squares (S’2). Compute variance/mean ratio = S2/X.
B. Grid size can be calculated as a fraction of total arena area. To test the hypothesis that animals divide available area equally, the arena is divided into « squares, one for each animal. This measure is called arena area distribution. Grid size = areaJn .
C. Alternatively, grid size can be calculated according to each species’ spacing. To test the hypothesis that second animals are excluded from average personal space-sized areas, a grid is made so that circles with radius of nearest neighbors mean distance fit inside each square. This measure is called personal space distribution. Grid size = [(2 x 1st nnd)2/2]*
Step 8 Percentage contact is the fraction of members who are touching each other per group = (number of touching animals x 100/«).
Step 9 Movement coefficient is computed as the percentage of the animals which move between observations = (number of changed positions x 100/«) (Table 1).
2 RESULTS
Each group of animals showed some measures which were significantly different when compared to the inanimate marble control, indicating that active spatial behavior took place. Most of the intraspecies replicates were similar, but two animal species showed significant differences between replicate groups; in those instances each group was compared to the control separately. Significant spacing measures could deviate from control values in either direction, i.e., some species spaced closer than
146
J. WESLEY BURGESS
expected (aggregated) while in others animals stayed distant from each other (uniformly dispersed) in the experimental environment. Replicate groups were compared by ANOVA or Student’s t test, and comparisons between each species and inanimate control values used Dunnet’s a posteriori test (Myers, 1973).
2.1 Inanimate Marble Control
The two independent replicates (I and II) which modeled passive distribution were not significantly different from each other in any measure ( p> .40) (Table 3). For comparison, first through fifth nearest neighbor distances were also calculated from Thompson’s (1956) equations for a randomly dispersed group of 25 points. The points were not different from the marbles’ distances (t(19); p > .20) (Table 3).
2.2 Rhesus Monkeys (Macaca mulatto)
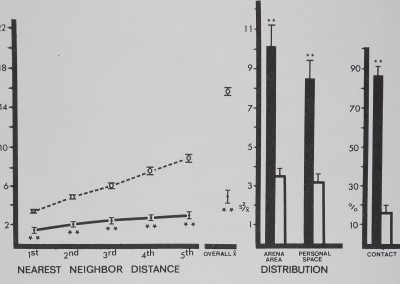
The two replicate monkey groups (I and II) were different only in first nearest neighbor distances (F(l,19) = 8.70; p < .01) and personal space distribution (F(l,18) = 10.47; p < .01), but not in other measures (p . 10) (Fig. 8). Group II was tested a year later (designated group III) and compared to I and II. Group III was still different from I in first nearest neighbor distance (F(l,15) = 45.17; p <.001) and personal space distribu-i tion (F(l,14) I 21.43; p< .01)lbut had not changed significantly from previous (II) values (p > .50).
Compared to inanimate control values (Fig. 8), rhesus monkeys^spaced significantly close to their first, second and third nearest neighbors. These close clumps of four individuals are referred to as spatial subgroups. Overall mean distance to all neighbors was significantly close, and the monkeys had more contact than the inanimate models (Fig. 8). The two distribution measures did not show a clear, significant pattern; only personal space distribution in group I indicated significant aggregation.
2.3 Communal Web Spiders (Mallos gregalis)
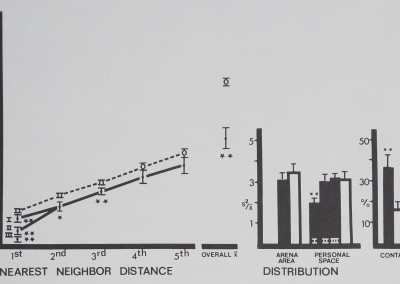
There was no significant difference between the two spider replicate groups in any measure (f(19); p< .50; borderline significance p < .05 for % contact). The communal spiders spaced significantly close to first and second nearest neighbors, forming small aggregations or spatial subgroups (Fig. 9). Like the rhesus monkeys, the communal spiders aggregated among close neighbors but not farther ones. Overall mean distance to all members was more distant than in the inactive control, doubtless as a result of farther neighbors’ distances. Distribution and percentage contact measures were not significantly active in either direction.
TABLE 3
Spacing of Passively Dispersed Marbles Described by Numerical Measures: A Model of Inanimate Spacing®
| Group | 1st | 2nd | 3rd | 4th | 5th | Overall distance (X) | Arena area distribution | Personal space distribution | % Contact |
| IX | 3.24 | 4.82 | 6.22 | 7.44 | 8.72 | 15.89 | 3.37 | 3.18 | 16.80 |
| ±SD | 0.47 | 0.51 | 0.63 | 0.82 | 0.95 | 2.56 | 0.76 | 0.82 | 10.28 |
| n | |||||||||
| X | 3.25 | 4.82 | 6.08 | 7.60 | 8.85 | 15.53 | 3.70 | 3.28 | 15.20 |
| ±SD | 0.41 | 0.38 | 0.57 | 0.76 | 0.82 | 1.26 | 0.95 | 0.76 | 6.19 |
| I vs II | |||||||||
| p (t test) | >.90 | >.90 | >.50 | >.50 | >.50 | >.50 | >.40 | >.90 | >.50 |
| X | 3.12 | 4.65 | 5.81 | 6.78 | 7.18 |
* Spacing measures of passively dispersed marbles offer an opportunity to compare inanimate spacing with active animals’ behavior in the experimental environment. The two replicate groups are not different from each other, nor from lst-5th nearest neighbor distances in 25 random points (Thompson, 1956). n = 10 observations of 25-member groups.
148
J. WESLEY BURGESS
Fig. 8. Spacing of rhesus monkeys (filled circles and bars), distance between neighbors (in animal units), and relative measures on the abscissa are plotted against their respective mean values (±SD) on the ordinate. The monkeys spaced significantly close to 1st, 2nd, and 3rd nearest neighbors, forming small aggregations or spatial subgroups. Overall mean distance shows that monkeys stayed significantly close to all group members. Monkeys contacted each other more than in the inactive model. Distances divided by mean animal length equal animal units: monkeys/1 m; marbles/1 cm. For comparisons with control (Dunnet’s test) df = 9,38 for 1st nearest neighbor and personal space distribution; df = 8,38 for all measures (**p < .01; *p < .02).
2.4 Neon Tetra Fishes (Hyphessobrycon innesi)
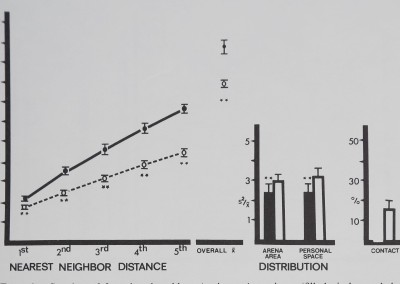
The two groups of neon tétras were different from each other in every distance measure: first nearest neighbor distance (F(l,18) = 9.70; p < .02); second nearest neighbor distance (F(l,18) = 14.88; p < .01); third nearest neighbor distance (F(l,18) = 18.03 ; P < .002); fourth nearest neighbor distance (F(l,18) = 22.00; p < .002); fifth nearest neighbor distance (F(l,18) = 20.17;/? < .002); and overall mean distance (F(l,18) = 12.58; p < .01). Unlike the previous species, neon tétras spaced significantly close to all five nearest neighbors and overall mean distance to all group members was significantly close (Fig. 10). Both distribution measures showed significant aggregation. No contact was observed in either group.
2.5 American Cockroaches (Periplaneta americana)
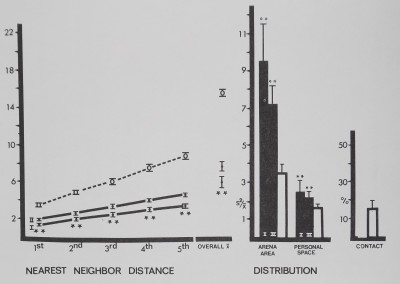
Like the neon tétras, the group of cockroaches spaced significantly close to all five nearest neighbors and overall mean distance was significantly closer than the inanimate control values (Fig. 11). Both distribution mea-

MEASUREMENT OF SPATIAL BEHAVIOR
149
Fig. 9. Spacing of communal web spiders Mallos gre galls (filled circles and dark bars) is compared to inanimate control values (open circles and bars). Distances between neighbors (in animal units) and relative measures on the abscissa are plotted against their respective mean values (± SD) on the ordinate. The communal spiders spaced significantly close to 1st and 2nd nearest neighbors, forming small aggregations or spatial subgroups. Overall mean distance shows that group members stayed significantly farther apart overall than in the inactive model. Distances divided by mean animal length equal animal units: communal spiders/0.48 cm; marbles/1 cm. For comparison with control (Dunnet’s test) df = 9,38 for 1st nearest neighbor distance and personal space distribution; df = 8,38 for all other measures (**/? < .01).
sures showed significant aggregation, but in contrast to other species a majority of the animals had significant contact.
2.6 Funnel Web Spiders (Agelenopsis utahena)
No significant differences were found between the two spider groups (t(19); p> .20) in any measure. Funnel web spiders spaced significantly distant to their first through fifth nearest neighbors. Overall mean distance to all neighbors was significantly distant compared to the inanimate control (Fig. 12). Of all the species tested, only the funnel web spiders had personal space sizes so large that both distribution measures were calculated on essentially the same block size, i.e., the spiders in a group divided up their arena area equally. The distribution measures showed significantly uniform spacing, also indicating maximum distances. No contact was observed in either group.
2.7 Eye Gnats (Hippelates pusio)
No significant differences were found between the two eye gnat groups (t( 19); p >.10, borderline significance,/? < .05 in fifth nearest neighbor
distance and arena area distribution). First nearest neighbors were neither

150
J. WESLEY BURGESS
Fig. 10. Spacing of neon tetra fish (filled circles and dark bars) is compared to inanimate control values (open circles and bars). Distances between neighbors (in animal units) and relative measures on the abscissa are plotted against their respective mean values (±SD) on the ordinate. Neon tetra fish stayed significantly close to their five nearest neighbors and overall mean distance to all group members was closer than inanimate values. Both distribution measures show significant aggregation. No contact was observed. Distances divided by mean animal length equal animal units: neon tetras/1.77 cm; marbles/1 cm. For comparison with control (Dunnet’s test) df g9,28 for 1st nearest neighbor distance and personal space distribution; df » 8,28 for all other measures (**p < .01).
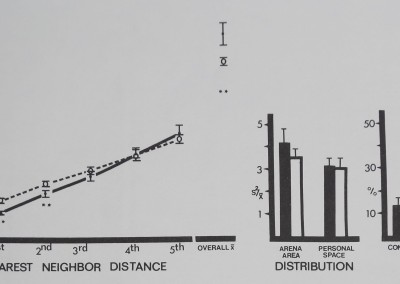
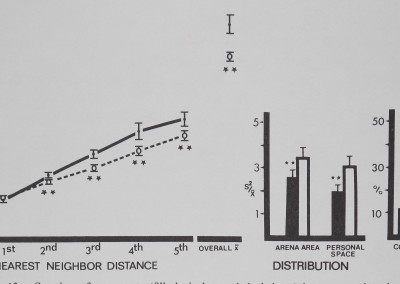
closer nor more distant than the inactive control; second, third, fourth, and fifth nearest neighbors were significantly distant (Fig. 13). Distribution measures show significantly uniform spacing. Like the funnel web spiders in these measures, eye gnats show maximum distance spacing toward many other neighbors. Overall mean distance and percentage contact were not different from the inanimate values in either direction.
2.8 Observations
The present group of measures can only provide a limited description of configurations of animals. In addition, visible differences in spacing and movement were apparent between the tested species. The communal web spiders, for example (Fig. 2), generally stayed near the walls of their arena and avoided the center. In addition to aggregation, neon tetra fishes (Fig. 3) generally oriented in the same direction and moved together over the arena. Individual American cockroaches (Fig. 4) would leave the aggregation one at a time to explore their arena. If a single individual in the neon

MEASUREMENT OF SPATIAL BEHAVIOR
151

Fig. 11. Spacing of American cockroaches (filled circles and dark bars) is compared to inanimate control values (open circles and bars). Distances between neighbors (in animal units) and relative measures on the abscissa are plotted against their respective mean values (±SD) on the ordinate. The cockroaches stayed significantly close to their five nearest neighbors and overall mean distance to all group members was closer than inanimate values. Both distribution measures show significant aggregation. A significant, high percentage contact was observed. Distances divided by mean animal length equal animal units: cockroaches/2.66 cm; marbles/1 cm. For control comparison (Dunnet’s test) df = 9,28 for 1st nearest neighbor distance and personal space distribution; df = 8,28 for all other measures
(**p < .01).
tetra or American cockroach groups were disturbed, a whole group flight response would often result, with many animals running across their arena. Funnel web spiders were found near to the arena walls (Fig. 5), but individuals were also seen in the arena center.
3 DISCUSSION
3.1 Group Spacing
The pattern of spacing measures in each species could distinguish it from the other species tested (Figs. 8-13). This agrees also with the original spacing hypothesis and the few other studies which have compared the spacing of different species in open fields. Desforges and Wood-Gush (1975) found significantly greater first nearest neighbor distances and overall mean distances in groups of five Aylesbury ducks compared to mallard ducks in barnyard lots. Distribution also looked different between the two duck species, but no distribution measures
J. WESLEY BURGESS
152
Fig. 12. Spacing of tunnel web spiders Agelenopsis utahena (tilled circles and dark bars) is compared to inanimate control values (open circles and bars). Distances between neighbors (in animal units) and relative measures on the abscissa are plotted against their respective mean values (±SD) on the ordinate. Funnel web spiders stayed significantly distant from their five nearest neighbors and overall mean distance to all neighbors was significantly more distant than inanimate values. Distribution measures show significant, uniform spacing. No contact was observed. Distances divided by mean animal length equal animal units: funnel web spiders/1 cm; marbles/1 cm. For control comparisons (Dunnet’s test) df = 9,38 for 1st nearest neighbor distance and personal space distribution; df = 8,38 for all other measures (**/? < .01).
were taken. Breder and Roemhild (1947) measured distribution in groups of four fishes belonging to six species. Their distribution curves show striking differences which are probably significant. Williams (1964) measured the perimeter of small groups in five fish species and found indications of differences, but none that were significant.
The replicates tested within each species permitted a comparison of the specificity of spacing between two groups of the same species. Both vertebrates, rhesus monkeys, and neon tétras showed significant differences between their two replicate groups in some measures, without deviating from their overall species’ patterns (Figs. 8 and 10). The four invertebrate species were not as variable between groups (cf. species/ individual variability for a single type of invertebrate behavior: Witt, Reed, & Peakall, 1968; Witt, Rawlings, & Reed, 1972; Risch, 1977). These findings may be of importance for future students of these species’ spacing if they plan to investigate group differences or need subjects with little variability.

MEASUREMENT OF SPATIAL BEHAVIOR
153
riG. 13. spacing oi eye gnats (tilled circles and dark bars) is compared to inanimate control values (open circles and bars). Distances between neighbors (in animal units) and relative measures on the abscissa are plotted against their respective mean values (±SD) on the ordinate. Eye gnats stayed significantly distant from four of their five neighbors. Both distribution measures show significant, uniform spacing. Distances divided by mean animal length equal animal units: gnats/0.25 cm; marbles/1 cm. For control comparisons (Dunnet’s test) df = 9,38 for 1st nearest neighbor distance and personal space distribution; df = 8,38 for all other measures ‘.01).
3.2 Three Categories of Spacing Patterns
If all measures for each species are used to describe patterns of spacing, then the six species fall into three general categories. Our emphasis on the summed behavior of individuals invites particular attention to first through fifth nearest neighbor distances, to see if there is any meaningful communal pattern in the distances of animals to their other conspecifics.
The first general spacing pattern was evident in the groups of rhesus monkeys and communal web spiders. Both species spaced heterogeneously in small clumps of three or four significantly close individuals called spatial subgroups (Figs. 8 and 9). Distances to farther neighbors were not significantly closer nor more distant than the model’s spacing. Overall distance and distribution measures showed no clear pattern. These spatial subgroups are evident in the two species whose natural groups (troops and colonies) are most well defined and where communal behaviors play an important role in social life. The tendency to aggregate in subgroups of close neighbors, seen in these species, was first suggested hypothetically by Thompson (1956).
The second general pattern was seen in the groups of neon tétras and American cockroaches, which aggregated significantly both at close distances and over the whole group. Spacing was more homogeneous than in

J. WESLEY BURGESS
154
the monkeys and communal web spiders, with no spatial subgroups up to the fifth neighbor (Figs. 10 and 11). Overall mean distance and distribution measures indicated strong, significant aggregation. Both cockroaches and schooling fishes are presumed to gain some protection from aggregating in groups (Bell & Sams, 1973; Shaw, 1970, 1978). Complex communal behaviors are not known to occur in these groups. If attention to positions of five or more neighbors is involved in producing homogeneous spacing, this would help explain the whole-group flight response seen in both species when one member of a group was disturbed.
The third pattern was seen in eye gnats and funnel web spiders. Distances between four or five nearest neighbors were significantly greater than the model values, without spatial subgroups. Dispersion measures were significantly uniform, indicating that the whole group was spread out across the arena (Figs. 12 and 13). Uniform spacing behavior in nature is thought to increase resistance to predation (Tinbergen, Impkeoven, & Frank, 1967; Wilson, 1975, chapt. 2). Eye gnats disperse strongly in nature (Dow, 1959), while funnel web spider webs are generally not found touching (author’s field observations). Funnel web spiders and eye gnats differ from the other species because individuals are solitary for most of their life cycles. Funnel web spiders clearly spaced to the fullest extent of their arenas and divided available space equally between group members (i.e., both distribution measures were equivalent to each other). Funnel web spiders fled one by one from their conspecifics when disturbed, unlike the simultaneous whole group flight response of cockroaches and neon tetra groups. One possible explanation for the selection of uniform spacing behavior in both these species would be the securing of large feeding areas for the solitary adults, either for the building of prey-catching webs or for finding secretions of animal hosts.
3.3 Further Spacing Research Indicated by This Study
This study emphasizes the importance of using several measures in an attempt to describe group spacing. Figures 8-13 contain several examples where a group would have appeared to have spaced randomly (e.g., eye gnats’ first nearest neighbor distance) or different species’ spacing would have appeared similar (e.g., distribution coefficients of rhesus monkeys and neon tétras) if only a single measure had been used. The use of few or different measures could explain some conflicting spacing findings. For example, Breder and Roemhild (1947), Breder (1959; 1967), Williams (1964; 1966), Pitcher (1973), and others have come to different conclusions about the spacing mechanisms in fish schools after evaluating different spacing measures.
Obviously researchers cannot use every conceivable spacing measure, but which ones tell the most about animals’ behavior? Distances to successive nearest neighbors give information about both distribution and
MEASUREMENT OF SPATIAL BEHAVIOR
155
homogeneity of group spacing. Present findings indicate that additional distances beyond fifth nearest neighbors should be measured, to test for subgroups of six or more members, or for polygonal packing (Kendall & Moran, 1963; W. D. Hamilton, personal communication). If distances to all successive neighbors in a group were calculated, both distribution coefficients and overall mean distance measures would probably be repetitious. Successive nearest neighbor distances offer another advantage: They evaluate a matrix of distance responses between pairs of individuals, which may have more behavioral relevance than more general measures like the distribution coefficients.
The control used in this study permits comparisons of animal groups to a pattern of nonliving spacing under standard conditions. However, it is complicated by possible responses of the animals to their open-field environments. This setting, by its very simplicity, is unnatural for animals; the experimenter assumes only that the behavior of animals placed in equivalent environments can be compared. During this study an alternative control comparison was devised which overcomes many of these limitations. If we hypothesize that there is no group effect on spacing (our null hypothesis), then the range of interanimal distances can be explained solely by individuals’ preference for positions in their open field environment, without regard for the positions of their surrounding conspecifics. Starting with a sufficiently large data set of a group’s positions over several intervals, animals’ positions can be randomly recombined across intervals to produce a control data set where animals’ positions in the new observations are no longer included with their surrounding conspecifics’. It is assumed that two animals observed at different periods do not influence each other’s spacing, particularly since all the group members will have changed their positions. Thus a randomly recombined set of data should preserve all the spacing relationships which are due to animals’ environmental preferences and not include spacing relationships which are a function of the positions of surrounding group members; this can be used as a control to test the group spacing hypothesis under known sets of conditions. For example, twenty observations of a group of five animals are made and spacing measures are calculated. Then using a random numbers table, animals are picked at random from the original data set and recombined into a new data set containing twenty observations of five positions each. Spacing measures are then calculated for this control data set, where animals in each observation were not necessarily present together. Comparing the original observations of animals’ positions vs the control set of the same animals’ recombined positions should distinguish active spacing better than a nonliving model. Use of such a technique would also be less dependent on the evenness of the testing environment. Observations of rhesus monkey troops are currently being analyzed in this way to test the utility of this method.
J. WESLEY BURGESS
156
Additional questions about spacing could be answered if environmental conditions of the groups were manipulated. In dealing with multifactoral systems (e.g., groups of animals; see Waddington, 1977, p. 30), it is recommended that many measures be taken while single environmental parameters are varied (Ashby, 1961; Weinberg, 1975). If variables such as group size, density, group composition, or available resources were varied, some environmental constraints on spacing could be tested. Proximal effects on spacing could be investigated by interrupting CNS systems with drugs (see Syme & Syme, 1973, 1974) or lesioning, or by changing animals’ prior experience (see Latané & Glass, 1968; Latané, 1969; Werner & Latané, 1974) or development (see Shaw, 1970; Williams & Shaw, 1971). Where spacing patterns differ between close species, researchers may find adaptive trade-offs which might accompany different spatial strategies.
3.4 Spacing Constructs
Is there a general construct which can explain the behavior of many animal species when they space in groups? Hediger (1941, 1950), Marier (1956), Crook (1963), and others (e.g., Esser, 1971) report the tendency of birds to take up predictable positions near their close neighbors when resting (e.g., individual distance). Individuals may show minimum dis9 tances they will approach toward each other (i.e., personal spaces; Sommer, 1959) or minimum distances they will stray from their group (i.e., social distance; Hediger, 1950). It has been suggested that spatial positions may be mediated by concurrent forces of approach and withdrawal between pairs of animals (e.g., Schneirla, 1939, 1959; Brown, 1948; Bre-der, 1954; Aronson, Tobach, Lehrman, & Rosenblatt, 1970). Studies of three-dimensional spacing in minnow schools (Pitcher, 1973) and hexagonal nest packing by royal terns (Buckley & Buckley, 1977) suggest that some groups’ spacing may reflect a predictable, overall pattern like atoms in a crystal lattice. None of these models describes well the spacing of all of the species tested in this study. Comparing coefficients of variation of the first five nearest neighbor distances (Table 4) does not indicate that first nearest neighbors’ distances were any less variable than farther neighbors’ distances, as the individual distance model might predict. The presence of spatial subgroups in rhesus monkey and communal web spider groups is not well explained by models of generalized responses to group members or overall geometric spacing patterns. Possibly attention to many or few surrounding group members may help explain the spacing heterogeneity seen in subgrouping. Unfortunately, few quantitative and comparative studies of animals’ distances taken over time are now available. If future studies continue comparing species groups with different spatial patterns or manipulate behavioral constraints on spacing, we may acquire the additional information needed to improve our constructs and
MEASUREMENT OF SPATIAL BEHAVIOR
157
TABLE 4
Coefficients of Variation for 1st—5th Nearest Neighbor Distance0
| Species | 1st | 2nd | 3rd | 4th | 5th | |
| Rhesus monkeys | I | 34.76 | 23.85 | 19.44 | 14.36 | 13.89 |
| II | 4U1 | 21.87 | 22.47 | 23.11 | 27.54 | |
| Communal web spiders | I | 12.73 | 12.56 | 11.88 | 12.97 | 16.71 |
| II | 21.90 | 15.96 | 17.44 | 19.94 | 20.02 | |
| Neon tetra fishes | I | 24.42 | 21.31 | 18.69 | 18.29 | 19.34 |
| II | 16.81 | 13.25 | 14.25 | 13.00 | 12.64 | |
| American cockroaches | I | 38.66 | 34.21 | 32.91 | 30.32 | 28.66 |
| Funnel web spiders | I | 7.51 | 12.80 | 9.97 | 7.13 | 10.43 |
| II | 11.65 | 15.36 | 11.00 | 13.39 | 13.48 | |
| Eye gnats | I | 3.15 | 14.86 | 10.24 | 19.38 | 14.38 |
| II | 18.60 | 9.89 | 12.78 | 25.41 | 9.88 | |
| Marble control | H9 | 7.48 | 10.81 | 10.35 | 10.89 | 8.85 |
| II | 12.94 | 8.61 | 9.31 | 10.20 | 9.18 |
a Coefficients of variation (SD x 100/A”) provide a way of directly comparing variance between groups whose means differ in magnitude. There is no clear trend in variance favoring closer or farther neighbors’ distances. These results do not indicate that 1st nearest neighbor distance is a better indicator of group spatial behavior than any other tested distance, and would not support a theory that group spacing only involves nearest neighbor responses.
confirm as false those assumptions that we considered erroneous (as suggested by Popper, 1972).
3.5 Conclusions
It has been shown that spacing behavior of these six species can be recorded, analyzed, and tested for patterns of active spatial organization. Several variables measured at the same time are required to adequately represent spatial patterns in the tested groups. Consistent overall mean distances (e.g., rhesus monkeys) and dispersion measures (e.g., funnel web spiders) demonstrate that the combined responses of individuals can result in a characteristic whole-group response. Both species-typical and group-typical patterns were found. All the spatial measures of the six species fall into three general patterns: close spatial subgroups in the more interactive groups of rhesus monkeys and communal web spiders; aggregated, more homogeneous spacing in the less interactive groups of neon tétras and American cockroaches; and distant, uniform distribution in solitary eye gnats and funnel web spiders.
Although students of animal and human behavior were aware early of the widespread tendencies of individuals to space relative to their con-specifics (Hediger, 1941; Marler, 1956; Hall, 1966; Argyle, 1969), few quantitative studies have examined group spacing behavior. As scientists become more aware of the adaptive functions of different spatial contigu-
J. WESLEY BURGESS
158
rations (Williams, 1966; 1975; Wilson, 1975; Dawkins, 1976), complementary research is needed to discover the structure of species’ spatial , organizations and the underlying processes responsible for them. The -present investigation shows the feasibility of the quantitative study of group spacing and offers one way to proceed.
REFERENCES
Allee, W. C., Emerson, A. E., Park, O., & Schmidt, K. P. (1949). Principles of Animal Ecology. Philadelphia: Saunders.
Argyle, M. (1969). Social Interaction. Chicago: Aldine.
Aronson, L. R., Tobach, E., Lehrman, D. S., & Rosenblatt, J. S. (1970). Development and Evolution of Behavior. San Francisco: Freeman.
Ashby, W. R. (1961). Introduction to Cybernetics. New York: Wiley.
Bell, W. J., & Sams, G. R. (1973). Aggressiveness in the cockroach Periplane ta americana (Orthoptera, Blattidae). Behavioral Biology, 9, 581-593.
Breder, C. M. (1954). Equations descriptive of fish schools and other animal aggregations.
Ecology, 35, 361-370.
Breder, C. M. (1959). Studies on social groupings of fishes. Bulletin of the American Museum of Natural History, 117, 393-481.
Breder, C. M. (1967). On the survival value of fish schools. Zoologica, 52, 25-40.
Breder, C. M., & Roemhild, J. (1947). Comparative behavior of various fishes under different conditions of aggregation. Copia 1, 29-40.
Brown, J. W. (1948). Gradients of approach and avoidance responses and their relationship to motivation. Journal of Comparitive and Physiological Psychology, 41, 450-465.
Buckley, P. A., & Buckley, F. G. (1977). Hexagonal nest packing of royal terns. Auk, 94,
36-43.
Burgess, J. W. (1976). Social spiders. Scientific American, 234(3), 100-106.
Burgess, J. W. (1978). Social behavior in group-living spider species. In P. Merrett (Ed.), Arachnology, pp. 69-78, London: Academic Press.
Burgess, J. W*, & Witt, P. N. (1976). Spider webs: design and engineering. Interdisciplinary Science Reviews, 1, 322-335.
Burgess, R. W. (1951). The life history and breeding habits of the eye gnat, Hippelates pusio,
Lowe in the Coachella Valley, Riverside County, California. American Journal of Hygiene, 53, 164-177.
Carpenter, C. R. (1964). Naturalistic Behavior of Nonhuman Primates. University Park,
Pa.: Penn. State Univ. Press.
Chamberlin, R. V., & Ivie, W. (1944). Spiders of the Georgia region of North America.
Bulletin of the University of Utah, Biology Series, 8(5), 1-267.
Clark, P. J., & Evans, F. J. (1954). Distance to nearest neighbor as a measure of spatial relationships in populations. Ecology, 35, 445-452.
Crook, J. R. (1963). The basis of flock organization in birds. In W. H. Thorpe and O. L.
Zangwill (Eds.), Current Problems in Animal Behaviour, pp. 125-149. Cambridge: Cambridge Univ. Press.
Davis, D. E. (1966). Integral Animal Behavior. New York: Macmillan Co.
Dawkins, R. (1976). The Selfish Gene. New York: Oxford Univ. Press.
Desforges, M. F., & Wood-Gush, D. G. M. (1975). A behavioural comparison of domestic and mallard ducks: spatial relationships in small flocks. Animal Behaviour, 23,698-705.
Diguet, L. (1909). Le mosquero. Bulletin de la Société Nationale d’Acclimation, France, *
56, 368-375.
Dow, R. P. (1959). A dispersal of adult Hippelates pusio, the eye gnat. Annals of the Entomological Society of America, 52, 372-381.
MEASUREMENT OF SPATIAL BEHAVIOR
159
Esser, A. H. (Ed.). (1971). Behavior and Environment. New York: Plenum.
Hall, E. T. (1966), The Hidden Dimension. New York: Doubleday.
Hediger, H. (1941). Biologische gestzmassigkeiten im verhalten von Wirbeltieren. Mitteilungen der Naturforschenden Gesellschaft in Bern.
Hediger, H. (1950). Wild Animals In Captivity. London: Butterworth.
• Henson, W. R. (1961). Laboratory studies on the adult behavior of Conopthorus coniperda
(Coleoptera: Scolytidae). II. Thigmotrophic aggregation. Annals of the Entomological Society of America, 54, 810-819.
James, M. T., & Harwood, R. F. (1969). Medical Entomology, New York: Macmillan Co.
Kendall, M. G., & Moran, P. A. P. (1963). Geometrical Probability. New York: Hafner.
Latané, B. (1969). Gregariousness and fear in laboratory rats. Journal of Experimental and Social Psychology, 5, 61-69.
Latané, B., & Glass, D. C. (1968). Social and nonsocial attraction in rats. Journal of Personality and Social Psychology, 9, 142-146.
McCook, H. (1889). American Spiders and Their Spinningwork. Philadelphia: Allen, Lane and Scott.
Mager, N. Y., & Mager, S. K. (1961). A Guide to Tropical Fish. New York: Washington Square Press.
Marier, Peter. (1956). Studies of fighting in chaffinches. (3) Proximity as a cause of aggression. British Journal of Behaviour, 4, 23-30.
Myers, J. L. (1973). Fundamentals of Experimental Design. Boston: Allyn & Bacon.
Pielou, E. C. (1977). Mathematical Ecology. New York: Wiley-Interscience.
Pitcher, T. J. (1973). The three-dimensional structure of schools in the minnow Phoxinus phoxinus (L). Animal Behaviour, 21, 673-686.
Popper, K. (1972). Objective Knowledge. London: Oxford Univ. Press (Clarendon).
Risch, P. (1977). Quantitative analysis of orb web patterns in four species of spiders. Behavioral Genetics, 7, 199-238.
Schneirla, T. C. (1939). A theoretical consideration of the basis for approach-withdrawal adjustments in behavior. Psychological Bulletin, 37, 501-502.
Schneirla, T. C. (1959). An evolutionary and developmental theory of biphasic processes underlying approach and withdrawal. In M. R. Jones (Ed.), Current Theory and Research on Motivation, vol. 7. Lincoln: Univ. of Nebraska Press.
Shaw, E. (1970). Schooling in fishes: critique and review. In L. R. Aronson, E. Tobach,
D. S. Lehrman, & J. S. Rosenblatt (eds.), The Development and Evolution of Behavior, pp. 452-480. San Francisco: Freeman.
Shaw, E. (1978). Schooling fishes. American Scientist, 66(2), 166-175.
Sommer, R. (1959). Studies in personal space. Sociometry 22, 247-260.
Syme, L. A., & Syme, G. J. (1973). Effects of chlorpromazine and metamphetamine on sociability in rats. Psychopharmacologia, 32, 81-84.
Syme, L. A., & Syme, G. J. (1974). The role of sex and novelty in determining the social response to lithium chloride. Psychopharmacologia, 40, 91-100.
Thompson, H. E. (1956). Distribution of distance to Nth neighbor in a population of randomly distributed individuals. Ecology, 37, 391-394.
Tinbergen, N., Impekoven, M,, & Frank, D. (1967). An experiment on spacing out as a defense against predation. Behaviour, 28, 307-321.
Waddington, C. H. (1977). Tools for Thought. New York: Basic Books.
Weinberg, G. M. (1975). An Introduction to General Systems Thinking. New York: Wiley-Interscience.
Werner, C., & Latané, B. (1974). Interaction motivates attraction: Rats are fond of fondling. Journal of Personality and Social Psychology , 29, 328-334.
Williams, G. C. (1964). Measurement of consociation among fishes: Comments on the
160
J. WESLEY BURGESS
evolution of schooling. Publications of the Museum, Michigan State University Biology Series, 2, 351-383.
Williams, G. C. (1966). Adaptation and Natural Selection. Princeton, N.J.: Princeton Univ. Press.
Williams, G. C. (1975). Sex and Evolution. Princeton, N.J.: Princeton Univ. Press.
Williams, M. M., & Shaw, E. (1971). Modifiability of schooling behavior in fishes: The role of early experience. American Museum Novitates, 2448, 1-19.
Wilson, E. O. (1975). Sociobiology. Cambridge, Mass.: Harvard Univ. Press.
Witt, P. N., Reed, C. F., & Peakall, D. B. (1968). A Spider’s Web. New York: Springer-Verlag.
Witt, P. N., Rawlings, J. O., & Reed, C. F. (1972). Ontogeny of web-building behavior in two orb-weaving spiders. American Zoologist, 12, 445-454.
Worchel, S., & Cooper, J. (1976). Understanding Social Psychology. Homewood,Sill.: Dorsey.
